Give the exploration a question
A simulation is most useful when students have something specific to investigate. “Play with the pendulum” gives little direction. “Which changes the period more: doubling the length or doubling the mass?” creates a prediction that can be tested.
Choose a question that the model can answer. Read the assumptions and identify the relevant controls before the lesson. Decide whether students need a clear 2D diagram or the spatial context of a 3D apparatus. Neither format is automatically the better teaching choice.
Predict before pressing Start
Ask each learner to record a prediction and a reason. Accept different predictions at this stage; the point is to make their reasoning visible. A sketch, a short sentence or a small table is sufficient.
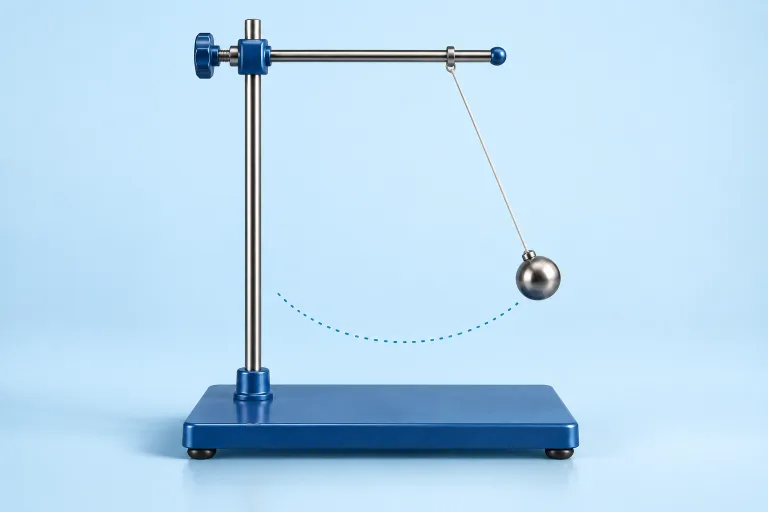
For a pendulum investigation, agree on what counts as one complete oscillation. Set a small release angle, keep gravity fixed and use zero damping when testing an ideal period relationship. Record the initial length and mass so later comparisons have a clear baseline.
Change one variable at a time
Investigate length first while holding mass and release angle constant. Measure several complete oscillations and divide total elapsed time by the number of cycles. Repeat for several lengths and record the results in the notebook.
Then return to the original length and change mass. Mixing changes to length, mass and amplitude in one trial makes it difficult to explain the result. If students want free exploration, reserve time after the controlled comparison and ask them to record what they changed.
Use the model to explain the evidence
For small angular displacements, an ideal simple pendulum has period T = 2π√(L/g). It predicts that doubling length multiplies the period by √2, while mass does not appear in the equation. A plot of T² against L should be linear under those assumptions.
Ask students to compare their observations with these predictions and explain any disagreement. Did they count half cycles, use a large angle, change gravity or measure too few oscillations? A discrepancy is a reason to investigate the method and model, rather than simply discard the observation.
Connect the screen to practical work
Discuss what the simulation leaves out: pivot friction, the finite size of a bob, timing reaction and uncertainty in the effective pendulum length. Where equipment is available, repeat one comparison physically and explain why real readings show variation.
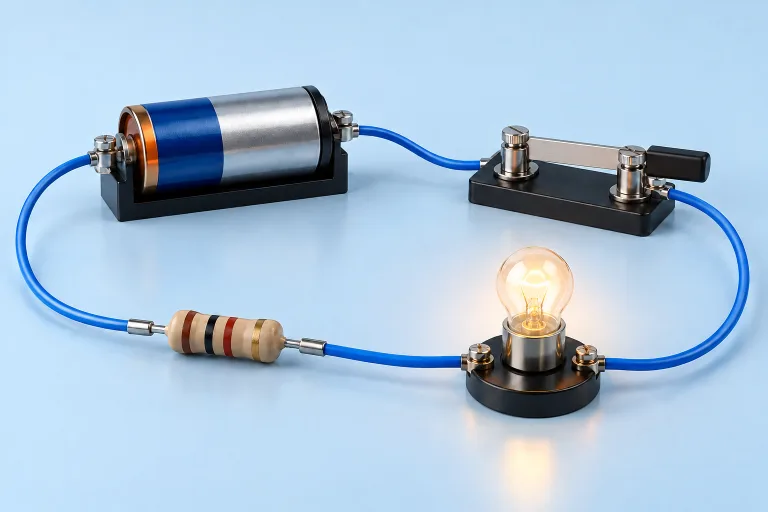
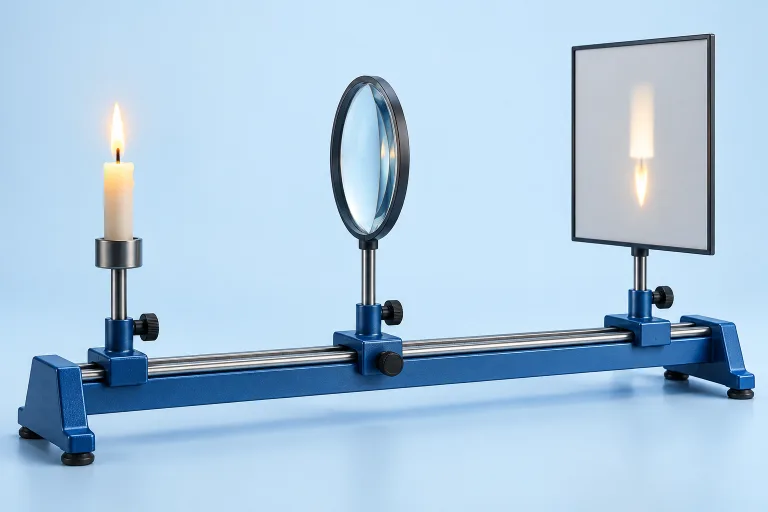
For circuits, compare an ideal constant-resistance component with a real filament lamp whose resistance changes as it heats. For lenses, compare the thin-lens model with the alignment and focus limits of a physical bench. Students should learn both the relationship and the conditions under which it applies.
Finish with something students can explain
End with a claim supported by a small data table, a graph or a labelled sketch. Ask learners to name one controlled variable and one limitation. Export notebook work before closing the page; do not rely on the browser session as permanent storage.
For a shared display, let one learner choose a setting while another predicts the result. Offer keyboard-accessible controls and a 2D alternative where available, and leave optional sound off unless it supports the question. Our teaching resources provide ready-to-use starting points for pendulums, lenses and circuits.
Sources and further reading
Found an error or a confusing explanation? Send a science correction.